

The Safest Parts Of England For Cycling
Cycling’s popularity has skyrocketed since the start of the pandemic as more and more of us have bought new bikes, or dusted off our old ones, to get out for some well-needed fresh air and freedom. For new cyclists, though, it can be really difficult to know where it’s safe - or not so safe - to cycle. That’s why we conducted the following study to help you decide which are the safest places to ride your bike in England.
To find out which parts of the country are safest for cyclists, we took the following metrics into account for each local authority in England:
- Number of people who cycle at least once per month
- Number of cyclists who were injured in a road accident
- Funding available via the Active Travel Fund
- Bike thefts
- CO2 emissions
- Vehicles on the road
To ensure that the data for each local authority was proportional and could be compared with others, we used population data from the Office for National Statistics Mid-2020 population estimates. All the data we used for our cycling safety statistics and more information on how we gathered this data can be found here.
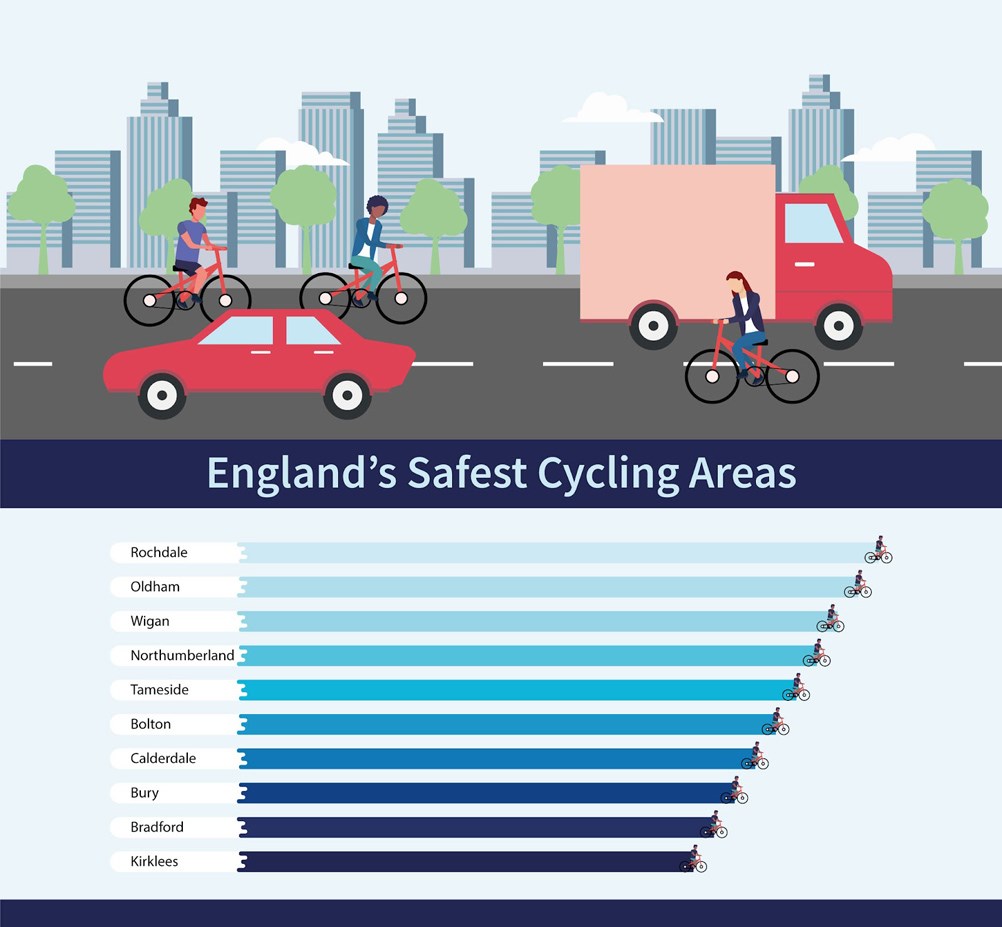
The Safest Place to Cycle in England is… Rochdale!
Believe it or not, our country's safest local authority to cycle is Rochdale in Greater Manchester, which is then followed by neighbouring towns Oldham and Wigan.
|
Local Authority |
Cycling Safety Score |
|
Rochdale |
28.33 |
|
Oldham |
35.00 |
|
Wigan |
36.17 |
|
Northumberland |
36.67 |
|
Tameside |
37.83 |
|
Bolton |
39.50 |
|
Calderdale |
41.67 |
|
Bury |
42.67 |
|
Bradford |
44.00 |
|
Kirklees |
44.67 |
The Top 10 Safest Parts of England to Cycle. Lower Cycling Safety Score = Safer
The 4th safest local authority for cyclists is Northumberland, with Tameside following in 5th position. This means that 4 of the top 5 safest areas to cycle in England can be found in Greater Manchester - which is great news for anyone who lives in or around the area!

Safest Places to Cycle in England in 2021
So Why is Rochdale the Safest Place to Cycle in England?
Is it the rolling hills? Are there more cycle lanes? Or do cyclists in Rochdale just generally ride in a safer way? Well, our research found that:
- It’s full of cyclists! 1 in 10 people in Rochdale cycle on a regular basis (at least once a month) this is twice as high as other areas such as Barking and Dagenham where just 1 in every 20 people cycle regularly.
- Very few road accidents in Rochdale involve cyclists. Only 0.1% of regular cyclists in Rochdale were injured in a road accident in 2019*. This is the equivalent of 1 in every 1,000 cyclists, whereas in the City of London, 1 in every 23 cyclists are involved in a road accident of some kind.
- Cycling is well-funded in the area. Rochdale Borough Council was allocated an estimated £5.57 per person in Tranche 2 of their Active Travel fund in November 2020 as part of the Greater Manchester Combined Authority. This is much higher than most other local authorities, such as Herefordshire, who’s Active Travel allocations worked out at just 62p per person.
- Bike thefts are few and far between - The number of bike thefts per 1,000 people in Rochdale is lower than that of almost all other local authorities in England, as just 0.17 reports of bike thefts were made per 1,000 people from April 2019 to March 2020. Whilst the area with the highest rate of bike thefts during this time period was the City of London which saw 40 bike thefts per 1,000 of its population.
- The air is fresh - As of 2019, Rochdale had 6 kilotonnes of CO2 emissions per square kilometer. This is far lower than that of many London boroughs which have the highest emission rates in the country by far - City of London, for instance, had 203.3 kilotonnes of CO2 emissions per square kilometer in 2019.
- Fewer vehicles on the road - When looking at the number of vehicles on the roads in Rochdale, there’s 0.48 vehicles per person, meaning there’s around 1 vehicle for every 2 people who live in the area. In commuter towns such as Slough and Milton Keynes, though, there are as many as 1.7 and 1.4 cars per person!
*We used data from 2019 for the majority of our metrics as data from this year was least likely to be skewed and/or impacted by the coronavirus pandemic.
Which Part of England is Home to the Most Cyclists?
If an area has a high proportion of cyclists, it’s likely that other road users in the area will be more aware of how to drive safely alongside them. What’s more, being around other cyclists can often help build up confidence in newer riders, which could have a knock-on effect on the way they ride.
Our investigation found that the beautiful London borough of Richmond upon Thames is home to the highest proportion of cyclists of any local authority in England. With more than a third (36.3%) of people in the borough cycling at least once a month. That’s more than 1 in every 3 people!
The Isles of Scilly and York also have a higher proportion of cyclists than any other local authority in England.
Cycling Accidents: Which Area Has the Lowest Rate of Accidents Involving Cyclists?
One of the most important factors to consider when determining the safest places to cycle is the number of accidents involving cyclists. In 2019 in the Isles of Scilly (just off the coast of Cornwall) not a single report was made of a cyclist being injured in a road traffic accident! This is somewhat unsurprising given the low population of the Isles of Scilly and that they have just 9 miles worth of road in total.
Leicestershire had the second lowest rate of cycling injuries in 2019, with 0.06% of frequent cyclists being injured in road accidents during this period. That’s the equivalent of 1 injury in every 1,667 frequent cyclists.
Cycling Spend: How Much Does Each Local Authority Spend on Cycling? And Who Spends the Most?
All local authorities in England are allocated an Active Travel fund (either directly or via their Combined Authority) to improve walking and cycling opportunities in their area. These funds cover things like cycling infrastructure, cycle lanes and bike parking as well as walking programmes and initiatives. Our research found that as of November 2020, the local authority which was allocated the highest funds per person was Brighton and Hove, whose Active Travel fund worked out at £8.14 per person.
Reading and Nottingham were also allocated some of the highest amounts per person for their Active Travel Funds, coming to £7.35 and £6.05 per head, respectively.
Bike Thefts: Which Areas Have the Fewest Reports of Stolen Bikes?
As well as feeling safe whilst riding your bike, it’s also important that you feel comfortable leaving your bike in a secure location when you’re not riding it. Whether that’s in your garden shed overnight or chained up outside your place of work.
During the 12 months ending March 2020, the area with the lowest incidence of bike thefts in England was Oldham where 0.12 bike thefts occurred per 1,000 people. That’s the equivalent of 1 bike theft per 8,333 people in Oldham. Rochdale, Bolton and Bury were also found to have a very low proportion of bike thefts when compared with other areas.
Fresh air: Which City Has the Least Carbon Emissions?
One of the best parts of cycling is getting out for some nice fresh air. But which parts of the country will you find the freshest for a bike ride? Our study found that as of 2019, the county of Northumberland had the lowest rate of CO2 emissions in the whole of England, with just 0.1 kilotonnes of CO2 per square kilometer.
The ocean spray and rolling hills of the Isles of Scilly, Cumbria and North Yorkshire followed closely behind, alongside the stunning counties of Herefordshire and Derbyshire.
Vehicles Per Person
Another factor we took into account when determining the safest parts of England for Cycling were the number of vehicles on the road per inhabitant. Believe it or not, the top 17 areas with the fewest vehicles on the roads per inhabitant are all in London!
The London borough of Tower Hamlets has just 0.16 vehicles per inhabitant, which is roughly equal to 1 vehicle for every 6 people. These low figures in London are likely due to the fact that these areas are extremely densely populated, meaning that the ratio of people to vehicles in these parts of the country are low.
Where Does Your City Rank on the Safest Cycling Spots in England Leaderboard?
Check out the table below or our interactive map to find out how safe it is to cycle in your local area!
|
Local Authority |
Cycling Safety Score |
|
Rochdale |
28.33 |
|
Oldham |
35.00 |
|
Wigan |
36.17 |
|
Northumberland |
36.67 |
|
Tameside |
37.83 |
|
Bolton |
39.50 |
|
Calderdale |
41.67 |
|
Bury |
42.67 |
|
Bradford |
44.00 |
|
Kirklees |
44.67 |
|
Dudley |
45.50 |
|
Thurrock |
47.00 |
|
Knowsley |
47.67 |
|
Stockport |
49.50 |
|
Rotherham |
50.00 |
|
County Durham |
50.17 |
|
Salford |
50.33 |
|
Barnsley |
50.67 |
|
St. Helens |
52.50 |
|
Wirral |
55.00 |
|
Essex |
55.33 |
|
Gateshead |
56.00 |
|
Walsall |
56.33 |
|
Harrow |
57.00 |
|
South Tyneside |
57.17 |
|
Sunderland |
57.17 |
|
Trafford |
57.33 |
|
Blackburn with Darwen |
58.00 |
|
Barnet |
58.17 |
|
Wakefield |
58.33 |
|
Isle of Wight |
58.50 |
|
Staffordshire |
58.67 |
|
Sandwell |
59.17 |
|
Bexley |
59.33 |
|
Havering |
59.50 |
|
Medway |
59.50 |
|
Sheffield |
59.83 |
|
Doncaster |
59.83 |
|
Torbay |
60.50 |
|
Enfield |
60.67 |
|
Halton |
60.83 |
|
Southend |
61.67 |
|
Derbyshire |
61.83 |
|
Hertfordshire |
62.17 |
|
Kent |
62.33 |
|
Lancashire |
63.00 |
|
Cornwall |
63.00 |
|
East Sussex |
63.17 |
|
Buckinghamshire |
63.50 |
|
North Tyneside |
64.00 |
|
Northamptonshire |
64.00 |
|
Croydon |
64.67 |
|
Bromley |
65.00 |
|
Isles of Scilly |
65.50 |
|
Manchester |
66.33 |
|
Solihull |
67.17 |
|
Redcar and Cleveland |
67.33 |
|
Rutland |
68.67 |
|
Wolverhampton |
69.17 |
|
Plymouth |
69.17 |
|
Leicestershire |
69.33 |
|
Coventry |
69.67 |
|
Nottinghamshire |
70.17 |
|
Luton |
70.33 |
|
Telford and Wrekin |
70.67 |
|
Barking and Dagenham |
71.17 |
|
Redbridge |
71.50 |
|
Sefton |
72.00 |
|
Devon |
73.33 |
|
Liverpool |
73.50 |
|
Bath and North East Somerset |
73.83 |
|
Cumbria |
73.83 |
|
Hartlepool |
74.00 |
|
Shropshire |
74.17 |
|
Newcastle upon Tyne |
74.50 |
|
North Yorkshire |
74.83 |
|
Dorset |
75.50 |
|
Middlesbrough |
76.17 |
|
Central Bedfordshire |
76.17 |
|
Surrey |
76.33 |
|
Worcestershire |
76.33 |
|
Wiltshire |
76.33 |
|
Sutton |
76.50 |
|
Hillingdon |
76.50 |
|
Stockton-on-Tees |
77.17 |
|
West Berkshire |
77.50 |
|
Brent |
78.67 |
|
West Sussex |
79.33 |
|
North Somerset |
79.50 |
|
Darlington |
79.50 |
|
Wokingham |
79.83 |
|
Somerset |
80.33 |
|
Birmingham |
80.83 |
|
Leeds |
81.00 |
|
Nottingham |
81.33 |
|
Greenwich |
82.17 |
|
Warwickshire |
82.17 |
|
Hampshire |
82.50 |
|
Herefordshire |
82.83 |
|
Stoke-on-Trent |
83.17 |
|
Cheshire West and Chester |
84.33 |
|
Blackpool |
84.83 |
|
Oxfordshire |
85.17 |
|
Brighton and Hove |
85.67 |
|
Newham |
86.67 |
|
Reading |
87.00 |
|
Leicester |
87.00 |
|
Suffolk |
87.50 |
|
Ealing |
87.67 |
|
Bracknell Forest |
88.50 |
|
Norfolk |
88.83 |
|
Lincolnshire |
88.83 |
|
South Gloucestershire |
88.83 |
|
East Riding of Yorkshire |
91.00 |
|
Gloucestershire |
91.00 |
|
Cheshire East |
91.50 |
|
Milton Keynes |
93.00 |
|
Southampton |
93.33 |
|
York |
93.67 |
|
Windsor and Maidenhead |
93.67 |
|
Swindon |
94.00 |
|
Derby |
95.00 |
|
Warrington |
95.33 |
|
Lewisham |
95.50 |
|
Merton |
95.83 |
|
Haringey |
96.00 |
|
Kingston upon Hull |
96.17 |
|
Hounslow |
96.50 |
|
Waltham Forest |
97.33 |
|
Kingston upon Thames |
97.33 |
|
Bournemouth, Christchurch and Poole |
99.00 |
|
Richmond upon Thames |
99.83 |
|
Bristol |
101.67 |
|
North Lincolnshire |
101.83 |
|
Kensington and Chelsea |
102.17 |
|
Bedford |
103.50 |
|
Cambridgeshire |
104.33 |
|
North East Lincolnshire |
105.00 |
|
Camden |
106.00 |
|
Lambeth |
107.33 |
|
Slough |
107.50 |
|
Hackney |
108.17 |
|
Tower Hamlets |
108.33 |
|
Southwark |
108.67 |
|
Wandsworth |
110.17 |
|
Hammersmith and Fulham |
111.50 |
|
Islington |
112.17 |
|
Peterborough |
113.00 |
|
City of London |
114.17 |
|
Westminster |
116.17 |
|
Portsmouth |
121.00 |
English Local Authorities Ranked From Safest to Least Safe for Cyclists. See our methodology for more information about the data we collected from each local authority
So there you have it! All of the safest and least safe places to cycle in England. Did you know that cycling is one of the UK’s favourite forms of exercise? Ahead of running, football and even pumping iron in the gym! For all of the latest cycling statistics for the UK in 2021 and 2022, check out our most recent Cycling Statistics piece.
